North Atlantic Hurricane Activity: Trends, Intensity, and Duration (2014-2023)
The North Atlantic hurricane seasons from 2014 to 2023 show significant variations in storm frequency and intensity.
By analyzing storm counts, Accumulated Cyclone Energy (ACE), and storm duration, we gain a clearer understanding of
recent trends and their impacts on the region.
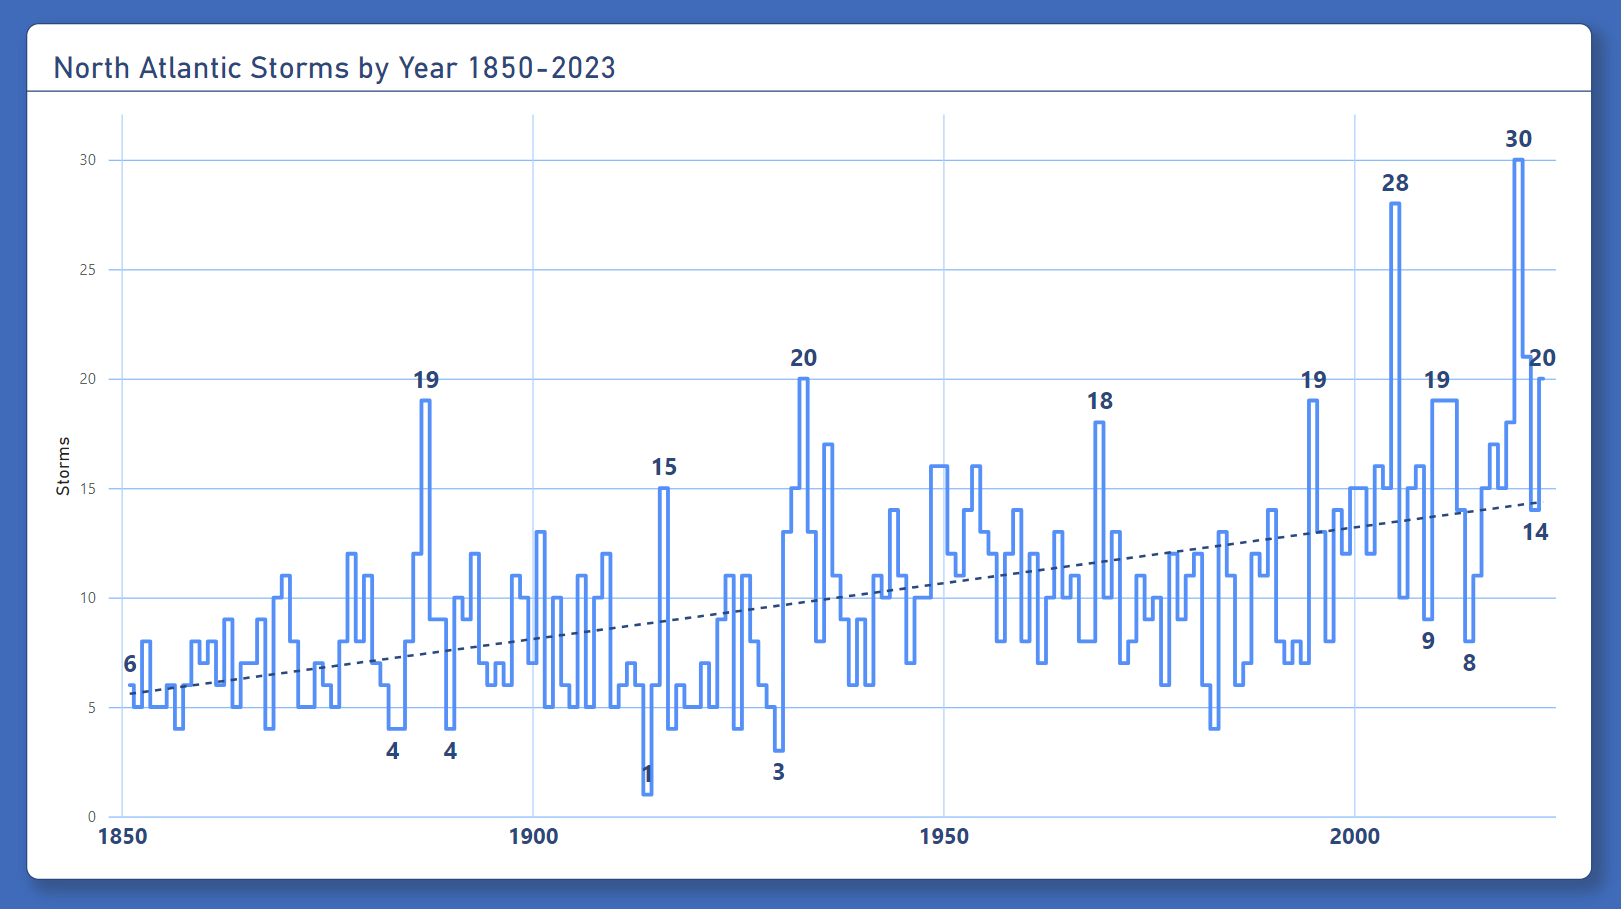
This chart illustrates the yearly count of North Atlantic storms from 1850 to 2023. Over this period,
a noticeable increase in the frequency of storms is evident. Early years, like the mid-1800s, typically
recorded fewer than 10 storms annually, with some years as low as 3 or 4 storms. However, more recent decades
have seen a significant rise in storm activity, with several years exceeding 20 storms, and a peak of 30 storms
in one of the latest years. The dotted trend line suggests a long-term upward trend in storm occurrences,
potentially highlighting the influence of changing climate conditions on storm frequency in the North Atlantic region.
Data source: Hurricane Database HUDRAT (NOAA)
https://ourworldindata.org
Tools: MySQL, Power BI
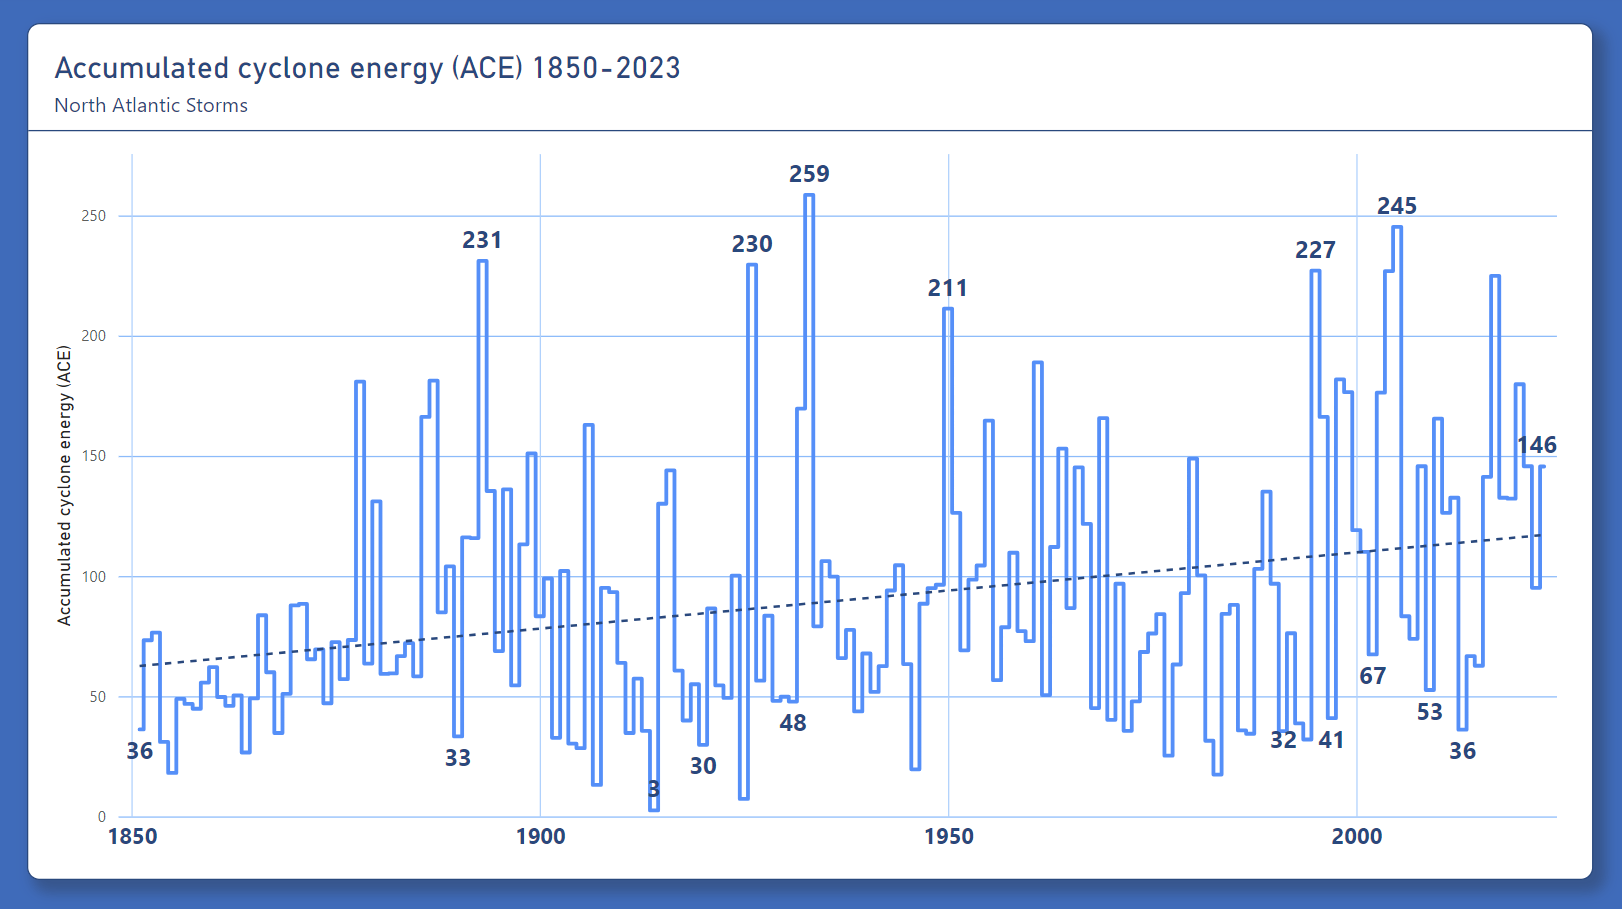
This chart shows the Accumulated Cyclone Energy (ACE) for North Atlantic storms from 1850 to 2023, a measure of storm
intensity and duration. The data reveals an overall upward trend in ACE values, with early years typically below 100
and more recent peaks, such as 259 and 245. The dotted trend line highlights the increase in cyclone energy over time,
suggesting that North Atlantic storms have generally become stronger and longer-lastin
Data source: Hurricane Database HUDRAT (NOAA)
https://ourworldindata.org
Tools: MySQL, Power BI
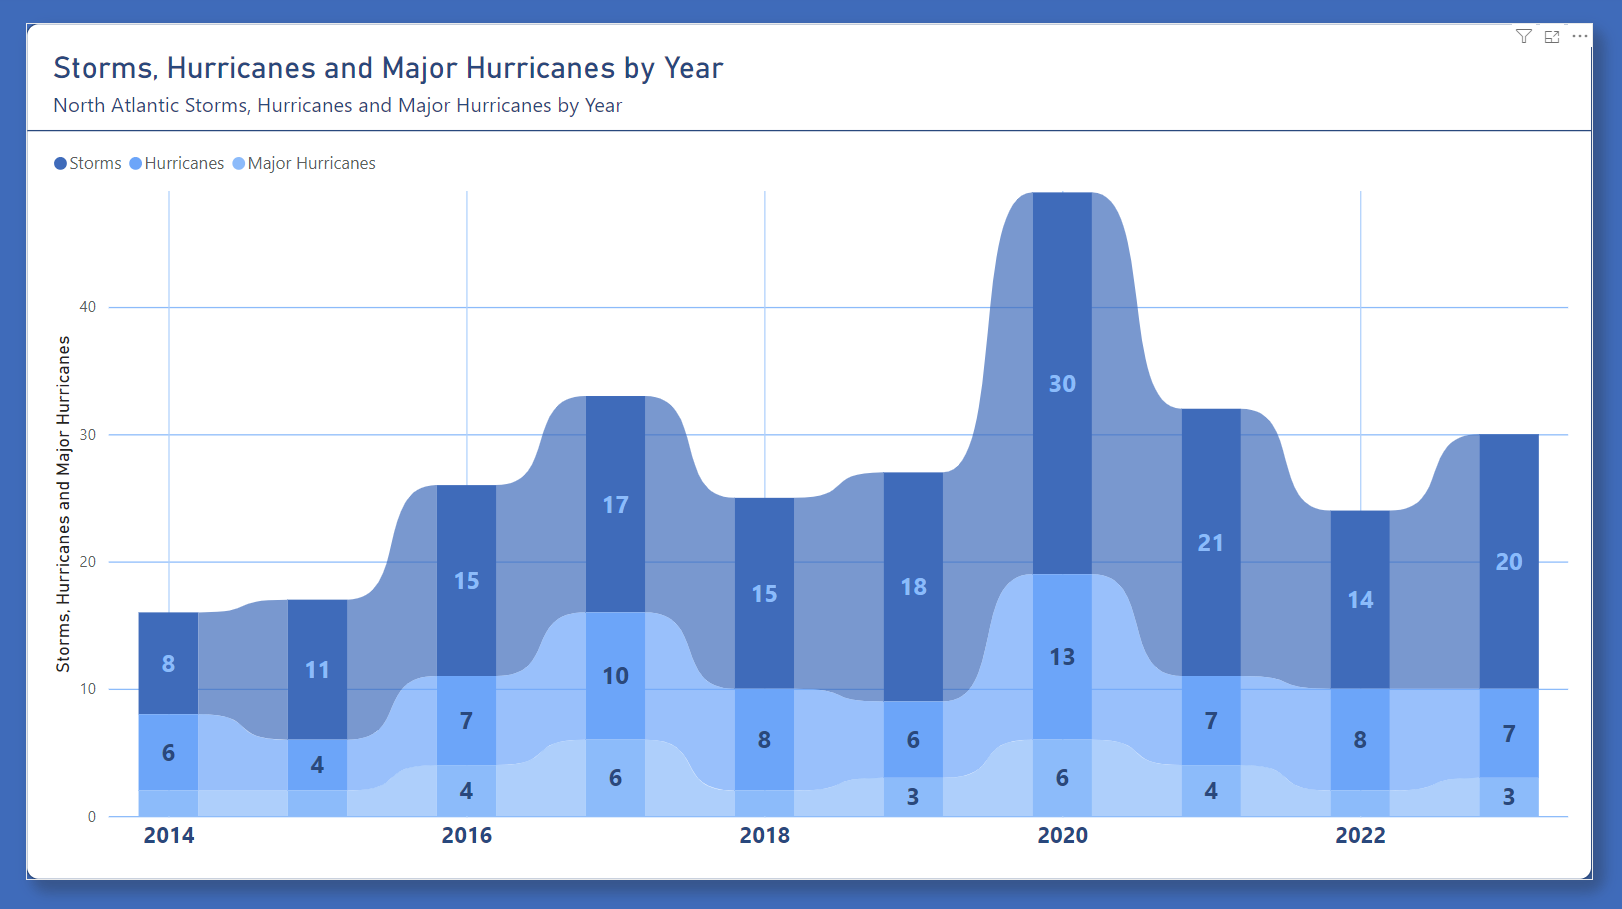
This chart shows the number of North Atlantic storms, hurricanes, and major hurricanes per year from 2014 to 2023. The
data reveals fluctuations in storm activity, with a notable peak in 2020, recording 30 storms, 13 hurricanes, and 6
major hurricanes. Other years, such as 2014 and 2015, saw much lower activity, with fewer than 20 total storms.
The layered bars visually represent the contributions of each category, highlighting the variability in storm intensity and frequency over this period.
Data source: Hurricane Database HUDRAT (NOAA)
https://ourworldindata.org
Tools: MySQL, Power BI
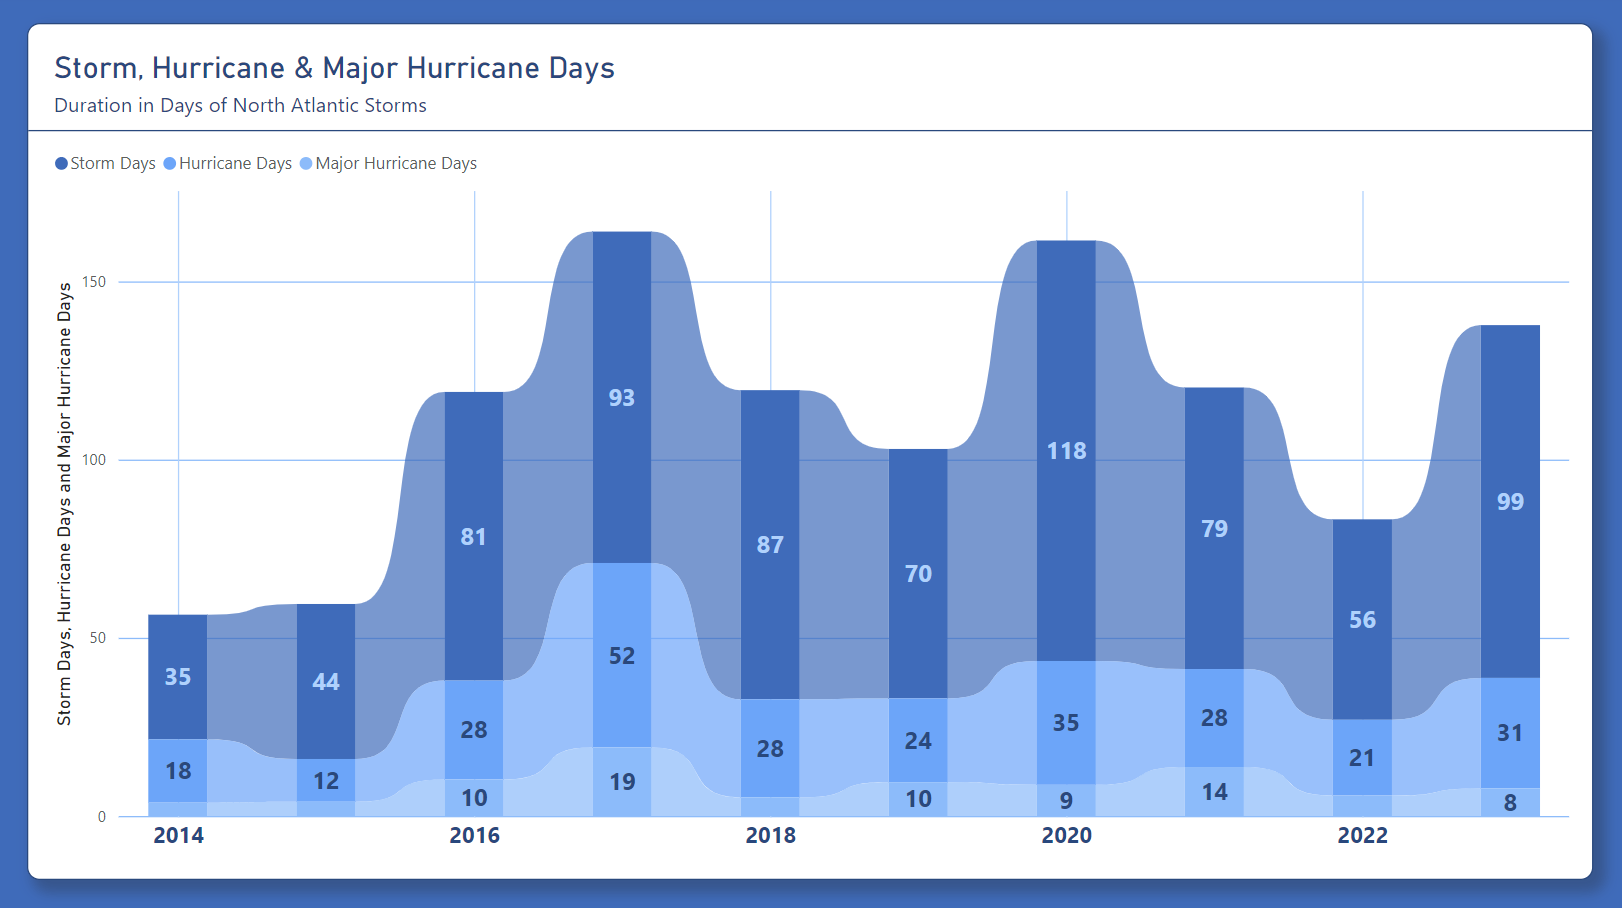
This chart displays the duration in days of North Atlantic storms, hurricanes, and major hurricanes from 2014 to 2023.
Each section of the bars represents the cumulative days for each category, showing the variability in storm duration year by year.
Notable peaks include 2020, with a total of 118 storm days, and 2017, with 93 days. Lower activity years, such as 2014 and 2015,
have significantly fewer total storm days. The layered design highlights the contributions of storm days, hurricane days, and major
hurricane days, offering insight into how long these intense weather events persisted over the years.
Data source: Hurricane Database HUDRAT (NOAA)
https://ourworldindata.org
Tools: MySQL, Power BI
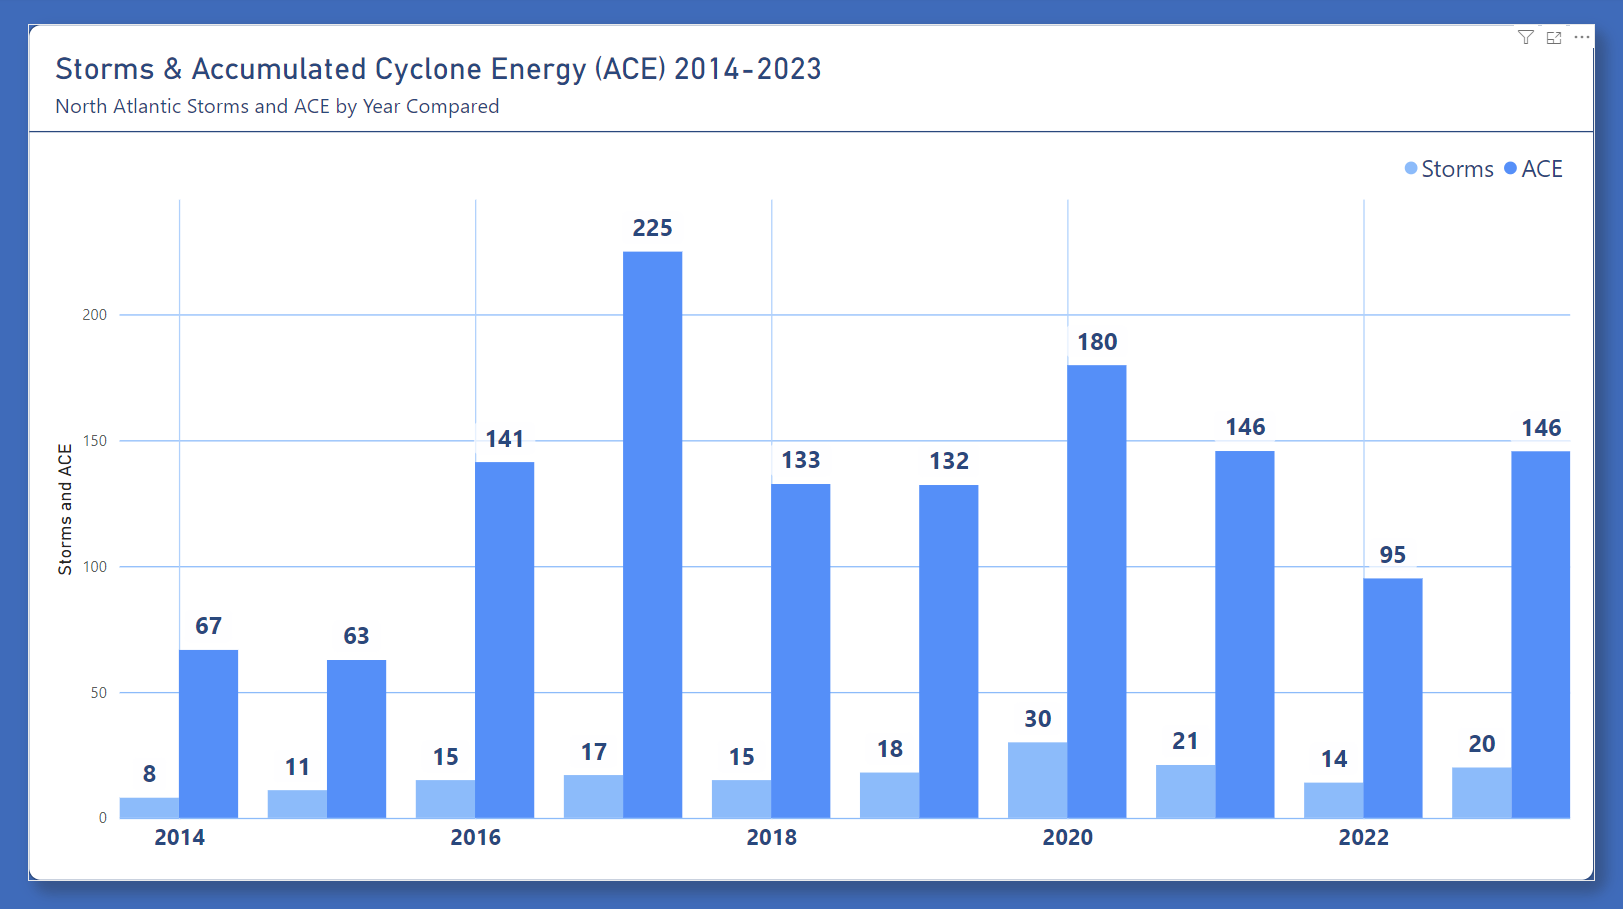
This chart compares the number of North Atlantic storms and their Accumulated Cyclone Energy (ACE) from 2014 to 2023. Each year’s
storm count is shown alongside its corresponding ACE value, highlighting both the frequency and intensity of storm seasons.
The highest ACE was recorded in 2017, with a value of 225, despite only 15 storms, indicating that those storms were particularly
intense. In contrast, 2020 saw 30 storms with an ACE of 180, reflecting a more active but slightly less intense season.
This comparison provides insight into the variations in storm activity and their overall energy.
Data source: Hurricane Database HUDRAT (NOAA)
https://ourworldindata.org
Tools: MySQL, Power BI
Between 2014 and 2023, hurricane activity varied widely, with 2020 recording 30 storms and 2017 reaching an ACE peak of 225.
While some years had fewer but stronger storms, others, like 2020, saw many storms with slightly lower intensity.
The duration of storm days also fluctuated, highlighting the unpredictability of recent hurricane seasons in the North Atlantic.